

An intro to "gnuplot" -- command line plotting tool for GNU/Linux
After a long time, I've started commit-ting to GitHub again (will keep on using GitLab too). While roaming around, found an old Gist of mine, discussing about gnuplot -- the command line plotting tool for GNU/Linux systems. The Gist is just a basic intro.
Here it is again, in script form:
#!/usr/bin/env gnuplot

# We are plotting a time-series data, Time in `HH:MM` is separated
# by a space with their respective Number, you can think of the
# number as the Number of Users of an Application. Here is a
# snippet of the input file `input.txt` (remove the hashes, of
# course); by default the output is shown on STDOUT, we're saving
# the output plot as `/tmp/out_image.jpg` (see below):

#12:00 2345
#12:15 5084
#12:30 2490
#12:45 3490
#13:00 4567
#13:15 4240
#13:30 3210


# `set title` sets the title of the graph/image, `font` sets the
# font name and size. We are setting the `font` as "calibri" and
# font size as 25. We can also set only the font size keeping the
# font as default which is "arial" e.g. `set title font ", 20"`.
set title "Time vs Number of Users" font "calibri, 25"

# Label on X-axis and font
set xlabel "Time in HH:MM" font "calibri, 20"

# Label on Y-axis and font
set ylabel "Number of Users" font "calibri, 20"

# `set` is used to set options of GNUplot. `set term` indicates
# what type of output to generate. Here we are generating JPEG
# image having size of 1200x800 pixels. The default is 640x480.
set term jpeg size 1200,800

# By default the resultant image is shown on STDOUT, `set output`
# redirects the output to the given file, the filename must be
# enclosed in double quotes
set output "/tmp/out_image.jpg"

# `set xdata` indicates the datatype used on the X-axis,
# `set xdata time` indicates the datatype is date/time.
set xdata time


# Indicates the format of the X-axis data given in the input, In
# our case we have used `Hour:Minute` format. For example, if our
# input is in the form `2015-12-04 14:45:34` then we would use
# `set timefmt '%Y-%m-%d %H:%M:%S'`
set timefmt "%H:%M"


# Things to note for the `tics` options:
# - A `tic` is a point of notation on the graph. Major tics are
# labelled tics i.e. `|` with labels e.g. on X-axis the time
# `01:30`, major tic-marks always refer to an input value.
# `set xtics` is used to manipulate major tic options on X-axis,
# similarly `ytics` is used for Y-axis.

# - There is another kind of tic-mark known as minor tics. These
# occur in between the major tics and are not associated with an
# input. These can be manipulated by `set mxtics` and `set mytics`
# for X-axis and Y-axis respectively.


# The label format of the major tics on X-axis, the specifiers
# are similar to `set timefmt`
set xtics format "%H:%M"

# Set font name and size for major tics on X-axis
set xtics font ", 15"

# Rotate the major tics on X by 90 degrees counter-clock-wise
#set xtics rotate by 90

# Range of intervals i.e. difference between two successive major
# tics on X-axis, it has another version which will set the start
# time and end time too having the format `set xtics "start",
# "interval", "end"` e.g. `set xtics "12:00", "00:30", "18:30"`.
# The end value can be omitted.
set xtics "00:15"

# `set grid` will set grid on major tics (both X & Y), we can use
# `set grid xtics` to draw grids on `X` axis's majot tics only.
# Similar goes for `ytics` and minor tics `mxtics`, `mytics`.
set grid xtics

# This will unset minor tic-marks on the X-axis that occurs in
# between the major tics. To turn it on we can use `set mxtics`,
# this will sub-intervals with a frequency of 2-5 (Depending on
# input). We can set the number of sub-intervals for minor tics
# by `set mxtics <freq>` e.g. `set mxtics 2`, this will generate
# 2 sub-intervals i.e. 1 minor tic between 2 major tics.
unset mxtics


# Let's modify Y-axis parameters, on Y-axis we are plotting number
# of users i.e. positive integers so we don't have much to modify.
set ytics 500
set mytics 2
set ytics font ", 15"
set grid ytics mytics

# `set key` shows the options given to the `plot` command on the
# image, to turn it off we need `set key off`.
set key off


# Let's plot our data
plot "input.txt" using 1:2 with lines linewidth 10

# `plot` command is used to draw plots, `input.txt` is our input
# file having all the input data to be plotted.
# `using` option of `plot` tells which columns are to be plotted,
# `using 1:2` means plot column-1 and column-2 of input data where
# column-1 is matched against column-2.
# `with` defines the style we want to plot data as e.g. `with lines`
# will plot data with `lines` style.
# Some other styles are `impulses`, `dots`, `steps`, `points`,
# `labels`.
# We can also set other parameters like `linewidth`, `linecolor`,
# `linetype` of a style using appropriate options of `with`.
# For example, to set a `linewidth` of 10 with the `lines` style we
# have used `with lines linewidth 10`.
Here is the input file, input.txt:
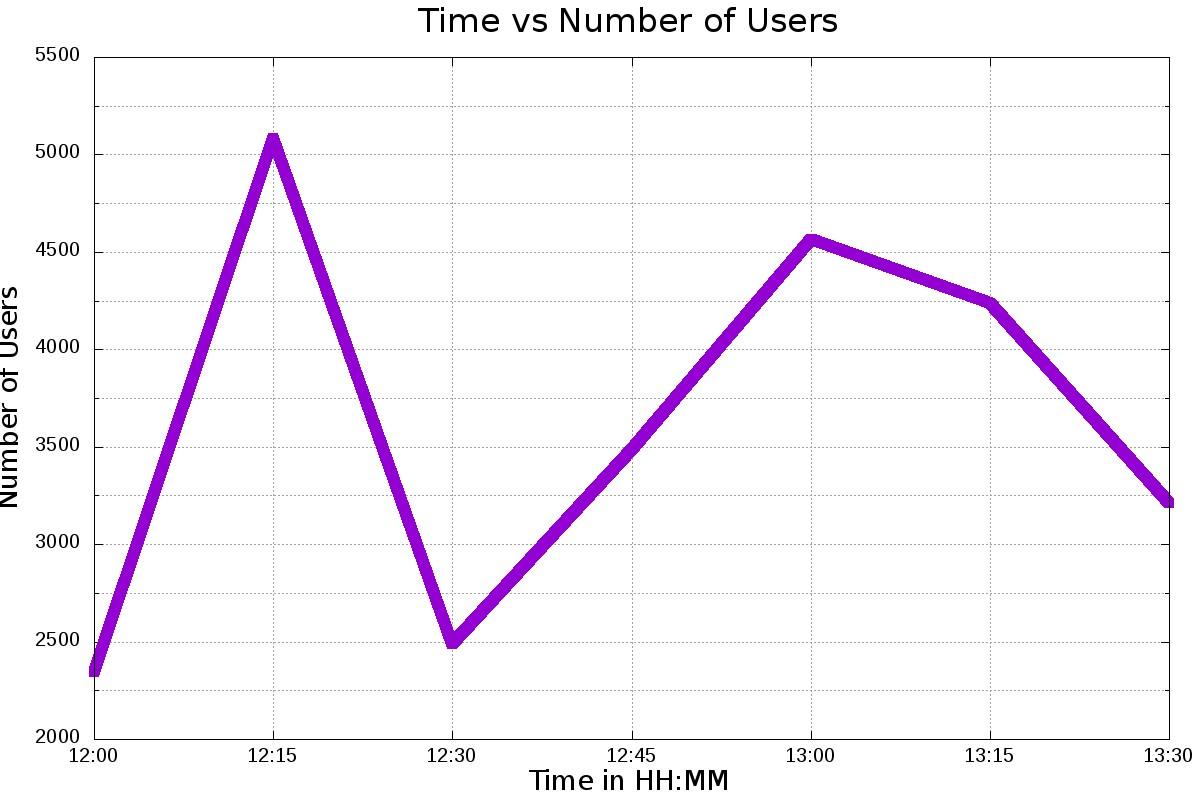
12:00 2345
12:15 5084
12:30 2490
12:45 3490
13:00 4567
13:15 4240
13:30 3210
To execute the script, make it executable and execute (assuming the script is script.gnp):
chmod u+x script.gnp
./script.gnp
Or, you can simply run the script as an argument to gnuplot:
gnuplot script.gnp
And the output (image) file, /tmp/out_image.jpg in this case:
Note: If not installed already, you can install gnuplot package by:
sudo apt install gnuplot  # Debian and derivatives
sudo yum install gnuplot  # Fedora and alike
All distros should have gnuplot package in their base repositories, so adding custom repositories should not be necessary.
Implementation detail: gnuplot is just the metapackage, installing it will automatically install the necessary Gtk/Qt and other necessary packages (as dependencies).
Happy gnuplot-ting!
Comments
Comments powered by Disqus